General Election had biggest generation gap since 1970s
New analysis shows how truly groundbreaking the 2017 General Election was, with the largest gap in vote by age ever recorded.
Tuesday 20 June 2017 13:40, UK
Pollsters Ipsos MORI have been analysing how people voted in elections since 1974.
They've just released their analysis for 2017 - and it shows how truly groundbreaking this election was.
So what happened?
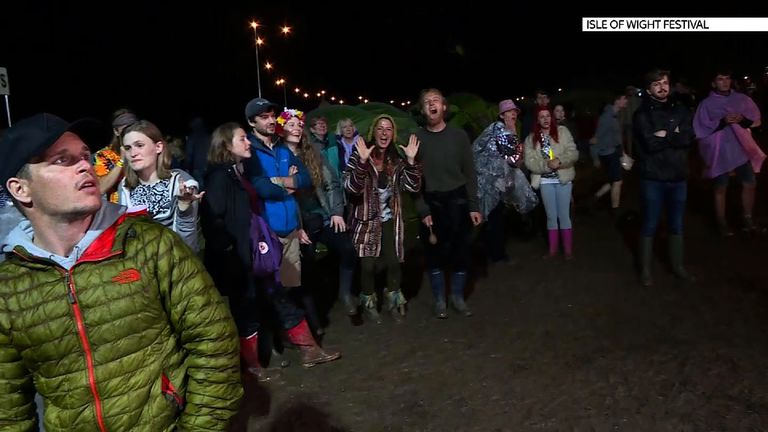
:: Young people turned out…
The proportion of young people aged 18-24 who voted was at its highest for 25 years.
A total of 54% of all 18-24 year-olds - including those who were not registered to vote - turned out on 8 June, up 16 points from their turnout in 2015.
Turnout was also up eight points among 25-34-year-olds, but was relatively unchanged for the rest of the population.


Those aged 18-24 were just as likely to turn out as those aged 25-44 this time around, in a marked change from previous elections - though older people were still more likely to turn out overall, with 71% of those aged 65 and over voting.
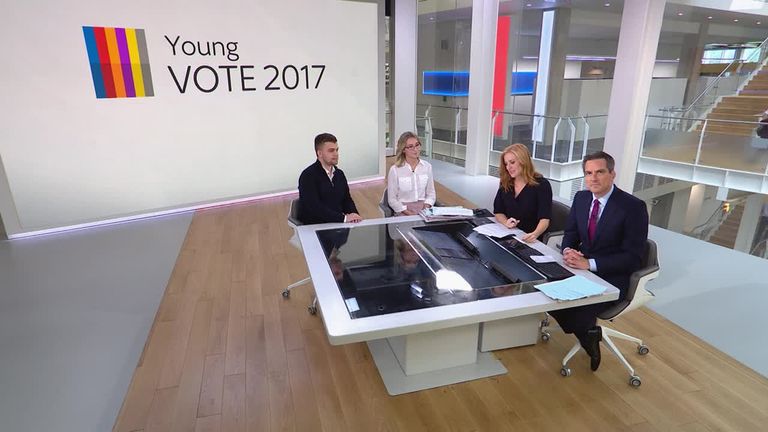
During the campaign Sky News invited a group of young first-time voters to . They commissioned our journalists to cover the stories they are directly affected by and answer the questions they pose.
We also asked them to guest edit a special Young Vote 2017 edition of the hugely popular Sky News Snapchat channel, as 70% of Sky News' audience on Snapchat is under 25.
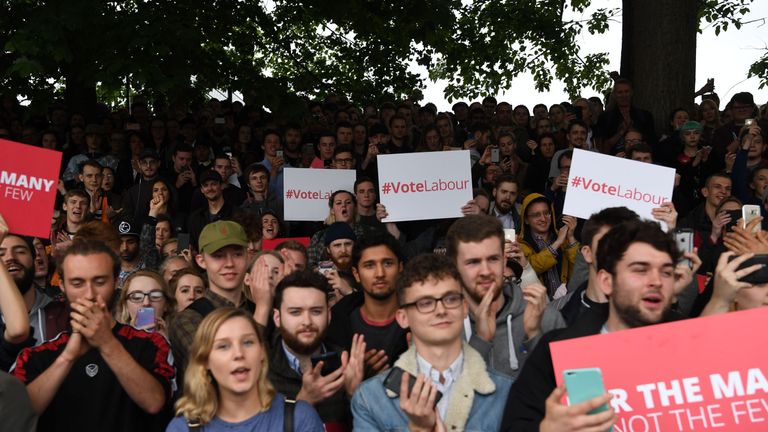
:: …and voted Labour in record numbers
The 2017 election had the largest gap in vote by age ever recorded since Ipsos MORI started analysing how people voted in the October 1974 general election.
Those aged 18-24 voted more for Labour by 62% to 27%, while those aged 65 and over voted more for the Conservatives by 61% to 25%.
And they swung in different directions, with younger voters voting more for Labour than they did in 2015, and voting more for the Conservatives than last time.
:: More working class people voted Tory
Middle class voters in the ABC1 social grades were more likely than ever to vote Labour rather than Conservatives - and working class voters (C2DE social grades) were more likely than ever to vote for the Conservatives rather than Labour.
Ties with their traditional votes had been weakening for decades, but with Labour up 12 points on their 2015 performance among middle class voters and the Conservatives up 12 points among the working class, both have very narrow leads among the classes they used to strongly rely on.
:: People with degrees voted Labour
Labour had a 15-point lead among graduates, while the Conservatives had a 17-point lead among those with no formal qualifications. This is obviously related to age and class, though the exact relationship - whether one causes the other - is unclear.
:: BME voters abandoned the Conservatives
Labour won a whopping 54-point lead among ethnic minorities, a swing of six points since 2015 - mostly as the Conservatives' vote share fell. Turnout among BME people was also up by six points.
:: The Conservatives took the majority of former Ukippers
Some 60% of those who voted UKIP in 2015 voted Tory this time around, compared with just 16% who voted Labour - only 18% stayed with UKIP.
:: Labour gained from the Lib Dems and previous non-voters
Almost a third (30%) of 2015 Lib Dems voted Labour this time, and 60% of 2015 non-voters who decided to vote this time voted Labour.
:: Only half of 2015 Lib Dem voters voted Lib Dem this time
While the overall vote share for the Lib Dems was relatively unchanged, there was a great deal of churn under the surface - only 51% of people who voted Lib Dem last time did so again this year, with rest coming roughly equally from Labour and the Conservatives.
Demographically they still look pretty similar though - doing best among graduates and Remainers, and worse among those with no formal qualifications.